(310) 550-6304
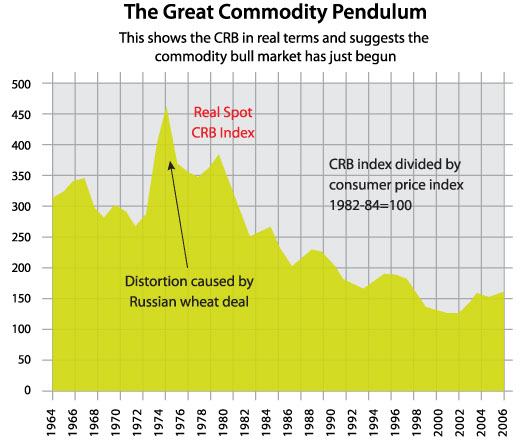
Commodity Research Bureau Index
—Adjusted for Inflation 1964-2006
by Kenneth J. Gerbino
The graph below shows that adjusted for inflation, the strong commodity bull market that started in 2001 has barely begun to catch up in real terms to the general price level of everyday goods and services in the 1960’s.
This graph implies that a doubling of commodity prices from 2006 levels would only take the index in real terms to the price levels of the 1960’s. Therefore commodity prices should continue to trend much higher over the next decade. This graph makes a strong case for investing in companies that own or produce natural resources especially precious and base metals.
With global liquidity increases at excessive levels the last five years and below average capital investment by commodity producers from 1983 to 2003, all markets (Bonds, Stocks, and Commodities) in all countries will be affected by this most likely coming mega-trend. Bonds and stocks will react negatively and commodities will stay in above average prices ranges and trend higher.

Kenneth J. Gerbino
Kenneth J. Gerbino
& Company
Investment Management
9595 Wilshire Boulevard
Suite 303
Beverly Hills, CA 90212
Phone: (310) 550-6304
Fax: (310) 550-0814
Kenneth J. Gerbino & Company
Investment Management
9595 Wilshire Boulevard, Suite 303
Beverly Hills, California 90212
(310) 550-6304
Copyright 2004-2018 Kenneth J. Gerbino & Company. All Rights Reserved. KENNETH J. GERBINO & COMPANY and its logo are trademarks and service marks owned by Kenneth J. Gerbino & Company. Site design and maintenance by www.DesignStrategies.com.