(310) 550-6304
Commodity Research Graph with Comments
by Kenneth J. Gerbino
This graph is telling an important story.
The Commodity Research Bureau (CRB) graph shows what took place in the U.S. economy that was almost 40% of the world’s GDP from 1962 to 1972. Commodity prices were in a historically low sideways range. Subsequently, the huge paper money increases from the 60’s and early 70’s finally took hold and prices of hundreds of basic goods exploded from 1972 -1982.
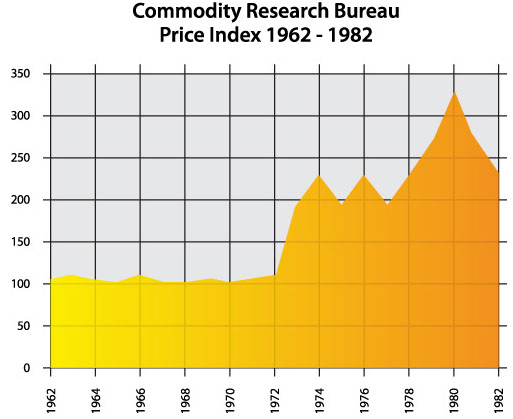
This was also a good time to be in the precious metal stocks as gold increased from $100 to over $800 (in 1980). Not shown on this graph is the fact that since 1982 the CRB again has gone sideways for almost 25 years in a higher sustained range from 200-400. The CRB today is now moving above 400 threatening to repeat a similar upward phenomena in the next 10 years or less for basic goods. The paper money increases of the 80’s and 90’s will most likely begin to effect the general price level just as past paper money increases did in the 70’s (not to mention the last 600 years of economic history). Basic material, precious and base metal mining companies owning these resources will certainly benefit from this expected trend.

Kenneth J. Gerbino
Kenneth J. Gerbino
& Company
Investment Management
9595 Wilshire Boulevard
Suite 303
Beverly Hills, CA 90212
Phone: (310) 550-6304
Fax: (310) 550-0814
Kenneth J. Gerbino & Company
Investment Management
9595 Wilshire Boulevard, Suite 303
Beverly Hills, California 90212
(310) 550-6304
Copyright 2004-2018 Kenneth J. Gerbino & Company. All Rights Reserved. KENNETH J. GERBINO & COMPANY and its logo are trademarks and service marks owned by Kenneth J. Gerbino & Company. Site design and maintenance by www.DesignStrategies.com.